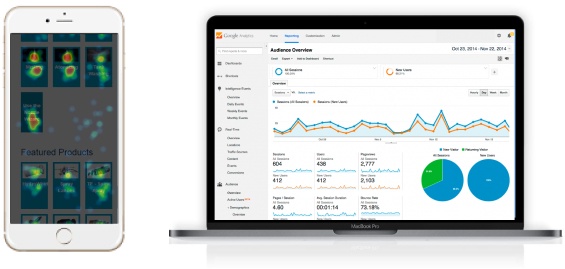
How much do you know about your users, and how much is assumed? Here’s an example of what we mean by that:
An international women’s fashion retailer approached us to find out more about their site visitors. Among other things, we told them that 25% of users were men. They weren’t surprised. But when we told them that the average male user spends more, is more likely to make a purchase and does so significantly faster than the average woman— that was very interesting indeed.
We’re not interested in facts for the sake of facts. What we’re after (and what we’re experts in hunting down) is actionable information: things you can, not just understand in real terms, but also use to make improvements and generate more revenue. Sometimes those elements are in line with expectations, and sometimes they are unexpected and surprising.


Are you leveraging the Right Data Sources?
As usual, our research starts with web analytics. Who are the people using your site? Where are they coming from? Who likes what they see, and who doesn’t?

Why JB Analytics?
The analysis of existing data often gives us pointers to most effectively deploy the next stage: heatmapping, user journey recording, timings and scroll tracking. This can highlight navigation difficulties, elements that are being under-utilized, checkout blocking and more.
Then we can move on to actually communicating with users through surveys (by email or with on-site popups) and structured UX testing.

