JB Web Data Driven Business Analysis
At JB Web we know that the amount of information businesses have to contend with is growing exponentially. We are witnessing an explosion of “Big Data” and are often overwhelmed in how to make sense of the mountains of numbers that are pouring in.
We can help.
We have a team of trained statisticians and data experts who can clean, collate, explore, process and visualize even the largest and most complex datasets and databases.
Moreover, we know that all data analysis should be tied to business fundamentals. We take the time to understand your business so our exploration is guided by your business goals, and our intelligence yields quick decisions.
JB Web Custom Data Analysis Programing
At JB Web we use a combination of statistical programing environments, including R, Python, Julia and Perl. This stack provides an open source environment which implements all of the latest and most powerful statistical algorithms, and allows for rapid exploration and visualization.
It enables us to deal with millions (or billions) of rows of data, to implement thousands of different statistical techniques, to rapidly explore and mine data for business insights, and to generate world class, print ready visualizations.
Example Visualization & Analysis Business Learnings
Geospatial Analysis
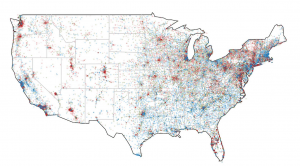
- Client: Fortune 500 Media Company
- Red: High Sales Per Capita
- Green: Average Sales Per Capita
- Blue: Low Sales Per Per Capita
Using orderlines from an online vendor, we converted purchase zip codes to lat/long points and then referenced against census population data.
This allowed identifications of regions that were over and underperforming relative to population, and drove key adjustments in media buying and creative targeting on an individual zip code basis.
Demographic & Survey Analysis
 A client wanted to know how their product was received differently by men and women, but had only a single email list. We were able to iterate over the entire database (2 million records) to extract names that were likely to have a given gender. For example, Jennifer = likely female, Michael = likely male, and Corey = unknown.
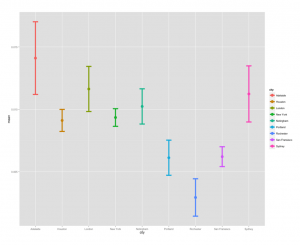
Using these, we were able to get the client the demographic data they needed, and to segment their list accordingly. Below is an example of another test showing media performance by city. Note that we report error bars (we are 90% sure the true value lies within those bars given our sample size). At JB Web we take accuracy seriously, and will always be transparent about how sure (and why) we are about our conclusions and recommendations.
Additional Analysis we have performed:
- Sales modeling in a given market
- Keyword volume research by niche
- Competitor incoming link graph for media outreach
- Custom Google Analytics media channel attribution work
- Exploratory data analysis on sales history
- Semantic clustering of user generated content to drive
- Category generation & information architecture generation
- Econometric and regression competitive sales analysis
- Keyword driven taxonomy/category creation
- Adaptive Bayesian analysis of A/B testing results
- Monte Carlo sale forecasting